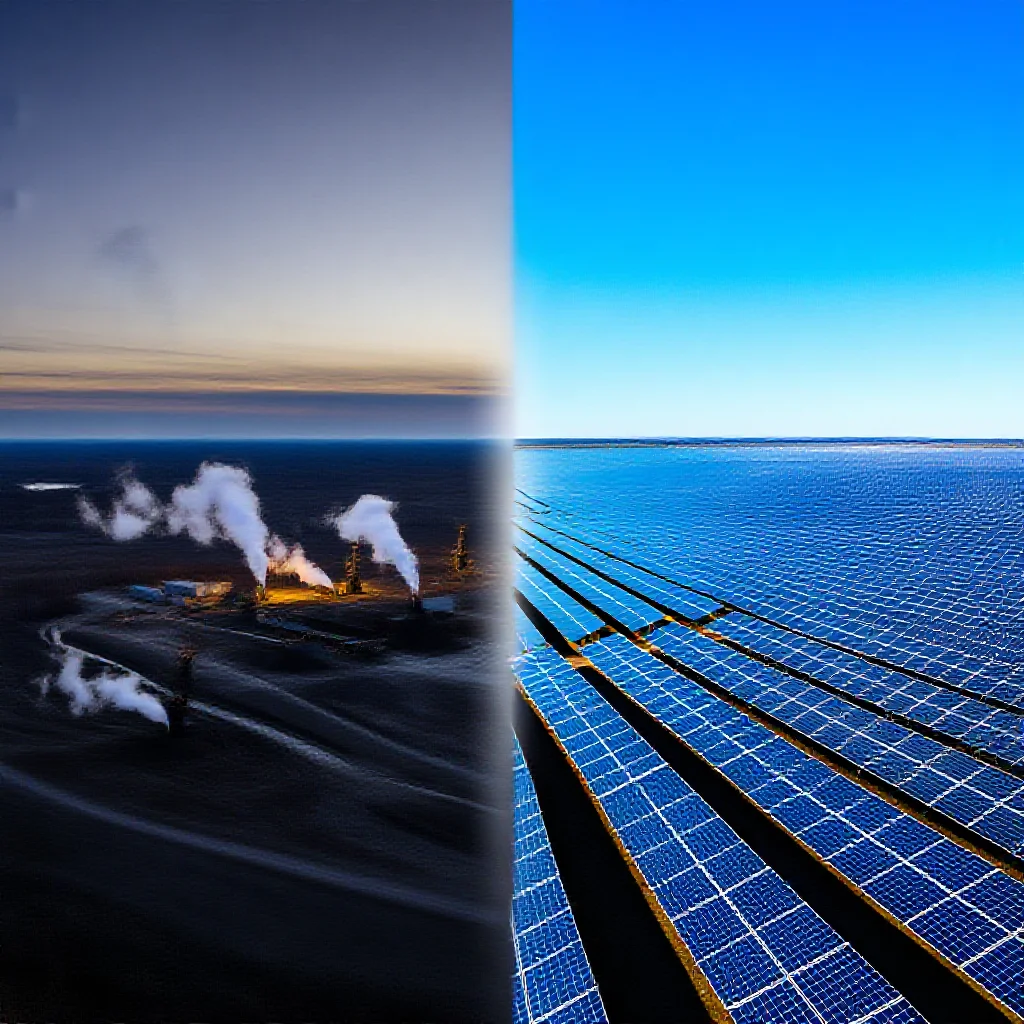
While global solar energy capacity soared by 32% in 2023, adding 420 GW and
Stalled Progress: Why Canada's Emissions Plateau Clashes with the Global Solar Surge
The Dueling Data: A Tale of Two Energy Transitions
The global energy transition is not a monolithic event. Its pace and nature diverge sharply across economies, a fact underscored by two concurrent data releases from 2023. On one hand, global solar photovoltaic capacity experienced a surge, growing by 32% and adding 420 gigawatts (GW) of new capacity. The International Energy Agency (IEA) reported that solar power alone constituted three-quarters of all renewable capacity additions worldwide for the year (Source 1: [IEA Report]). On the other hand, Canada’s national greenhouse gas inventory for 2022 showed a plateau. Total emissions remained unchanged at 708 million tonnes of carbon dioxide equivalent (Mt CO2e), identical to the 2021 figure (Source 2: [ECCC National Inventory Report]). This juxtaposition presents a central analytical question: what does this divergence reveal about the structural forces governing the energy transition in a major advanced economy with a significant hydrocarbon sector?
Decoding Canada's Emissions Plateau: The Oil Sands Anchor
The stability of Canada’s emissions is a result of countervailing sectoral trends. While reductions occurred in sectors such as electricity and buildings, these gains were fully neutralized by increases from the oil and gas sector. Emissions from this sector rose by 2.4%, or 5 Mt CO2e, in 2022 (Source 2: [ECCC National Inventory Report]). Within this sector, emissions from oil sands operations reached a record 92 Mt CO2e. This record high acts as an anchor, preventing an overall national decline.
The persistence of high emissions from oil sands is not an anomalous event but a function of structural inertia. Oil sands projects are characterized by extremely high upfront capital costs, multi-decade operational lifespans, and infrastructure designed for a specific resource type. This creates a powerful economic and physical lock-in effect. The investment cycles and operational parameters of these projects are structurally misaligned with the rapid, flexible deployment cycles seen in renewable energy. Consequently, even with efficiency improvements and some technological mitigation, the sheer scale and embedded carbon intensity of ongoing oil sands production present a formidable barrier to near-term emission reductions, offsetting progress made in more malleable sectors of the economy.
The Solar Tsunami: Market Forces Reshaping the Global Grid
The 32% growth in global solar capacity represents a shift from policy-driven adoption to market-driven dominance. The primary driver is a sustained and profound reduction in the levelized cost of electricity (LCOE) from solar PV, driven by economies of scale in manufacturing, technological improvements, and streamlined supply chains, particularly in China. This cost convergence has been reinforced by supportive policy frameworks in numerous jurisdictions. The IEA’s data confirms that solar has become the default choice for new power capacity in many markets, accounting for the overwhelming majority of renewable additions (Source 1: [IEA Report]).
The underlying logic of this growth contrasts fundamentally with that of hydrocarbon systems. Solar infrastructure is modular, scalable, and has relatively short deployment timelines. It can be deployed in distributed configurations or utility-scale farms, offering flexibility. This stands in opposition to the model exemplified by oil sands: centralized, capital-intensive megaprojects with long planning and payback periods, whose economic viability is tightly coupled to volatile global commodity prices and long-term demand assumptions. The solar surge is thus a manifestation of a different economic and technological paradigm gaining ascendancy in the global power sector.
Convergence or Divergence? Implications for Canada's Economic Future
The simultaneous occurrence of these two trends—global solar acceleration and Canadian emissions stagnation—is not coincidental but indicative of a deeper misalignment. For Canada, the analysis suggests its domestic emissions trajectory is currently held in check by the counterweight of its hydrocarbon export sector. The nation’s energy system is bifurcated: a domestic electricity grid increasingly integrating renewables, and a separate, globally-oriented oil and gas production system whose emissions footprint remains dominant in the national inventory.
The long-term implication hinges on the interplay between global market signals and domestic policy. If global demand for hydrocarbons remains robust, the economic incentive to maintain high levels of oil sands production will persist, challenging domestic emission targets. Conversely, if the global energy transition accelerates, driven by the continued cost decline of renewables and electrification, Canada faces a strategic risk of over-investment in long-lived hydrocarbon assets. The central challenge for policymakers and investors is to navigate this period of dual realities, where the economic logic of a legacy industry and the emerging logic of a new energy system exist in parallel, with the data from 2022-2023 illustrating the tangible outcome of that tension. The future trajectory will depend on which logic ultimately exerts greater force on capital allocation and regulatory frameworks.