Between 2012 and 2023, private capital deployed US$47.3 billion across 847
Africa's Infrastructure Investment Paradox: Private Capital Surges but Financing Gap Widens
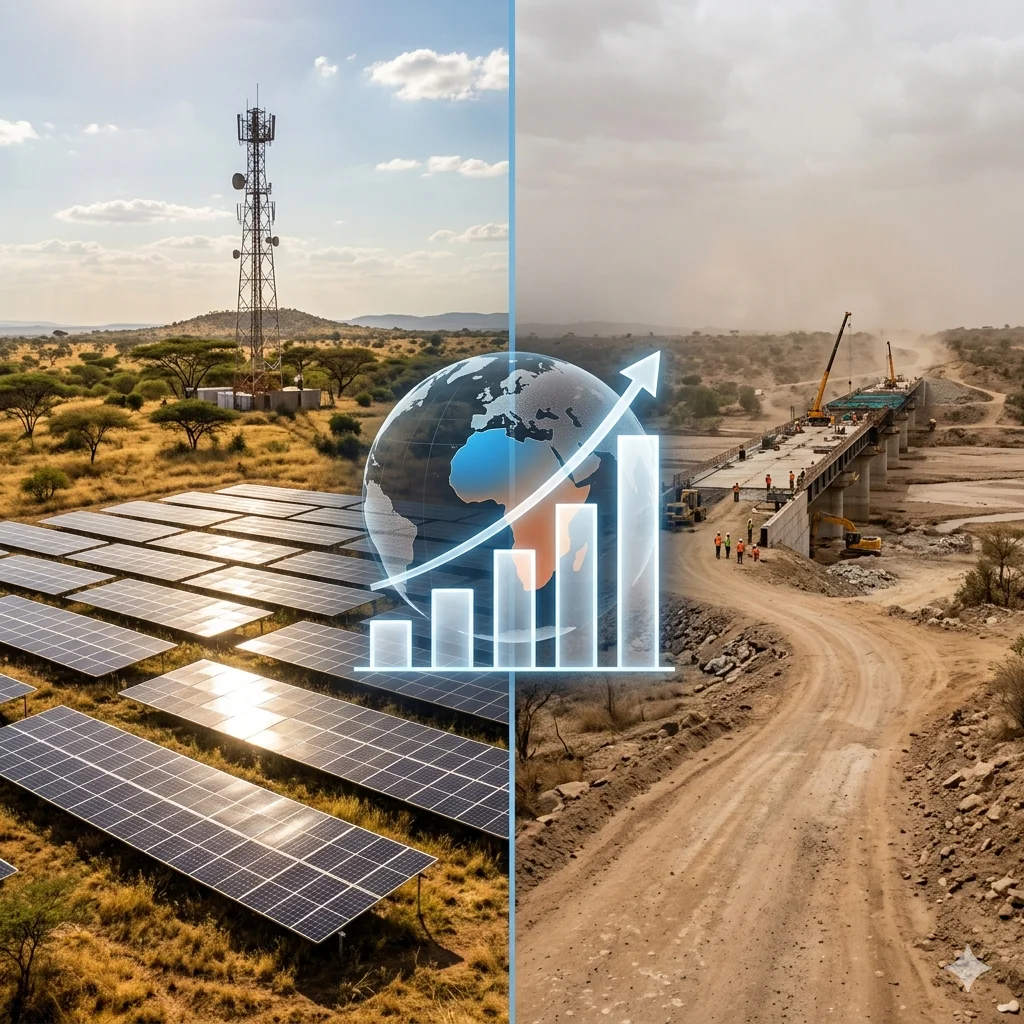
Between 2012 and 2023, private capital deployed US$47.3 billion across 847 deals in African infrastructure, with annual deal volume more than doubling over the period. Yet Africa receives only 5% of global infrastructure investment despite hosting 18% of the world’s population. The annual financing gap for basic needs—roads, electricity, water, and schools—stands at US$100 billion. Sub-Saharan Africa invests just 3.5% of its GDP in infrastructure annually, far below the 7.1% needed to meet the UN Sustainable Development Goals. This paradox—a surge in private money alongside a widening deficit—demands a closer look at where the capital actually goes, and why it fails to close the gap.
[IMAGE: Infographic showing Africa's share of global population (18%) vs. its share of global infrastructure investment (5%), with a bar for the US$100 billion annual financing gap.]
The Surge in Deal Volume: What’s Driving the Acceleration?
Private capital deals in African infrastructure more than doubled from an average of 43 per year between 2012 and 2015 to 101 per year between 2020 and 2023. That growth reflects both a maturing project pipeline and a global search for yield in an era of low interest rates—though rates have since risen, investor interest persists in sectors where returns are clear.
A critical feature of this surge is its fragmentation. 73% of all deals were below US$50 million, indicating a market dominated by small-scale investors—often local private equity funds, family offices, or development finance institutions acting bilaterally. At the other extreme, just 16 megadeals above US$500 million captured US$19.4 billion, or 41% of total value. These large projects were concentrated in energy and telecom, where returns can be contracted and risks underwritten by sovereign guarantees or multilateral backing.
Equity financing accounted for 88% of deals, far exceeding debt. This suggests investors are seeking control and long-term returns rather than passive interest income. But equity-heavy structures also mean higher capital costs and greater risk exposure, which can deter projects in sectors with long gestation periods, such as transport or social infrastructure.
[IMAGE: Bar chart comparing average deals per year across 2012–2015 (43) and 2020–2023 (101), with a note on the 73% share of deals under US$50 million.]
Sectoral Concentration: Energy and Telecom Dominate
The overwhelming majority of private capital flows to just two sectors: Energy and Telecommunications & Digital Infrastructure. Together they captured US$38.2 billion, or 81% of total deal value between 2012 and 2023. Energy alone accounted for US$22.5 billion across 308 deals, driven by independent power producers (IPPs) and renewable projects. Telecoms and digital infrastructure—fibre networks, data centres, mobile towers—attracted US$15.7 billion across 167 deals, reflecting Africa’s rapid digitalisation and growing demand for connectivity.
Healthcare ranked second by deal volume (30% of all deals) but received far less capital—just US$2.8 billion—indicating many small-scale health projects such as private clinics, diagnostic centres, or medical equipment leasing. These projects are numerous but individually small, and rarely attract the institutional capital needed to scale.
Transport infrastructure received only US$4 billion across 46 deals, despite representing the largest portion of Africa’s infrastructure financing gap: transport accounts for 73% of the gap, according to the African Development Bank. The mismatch is stark. Private capital avoids roads, railways, and ports because these assets rarely offer the clear, contract-based revenue streams that energy and telecom provide. A toll road in a low-income country carries demand risk; a mobile tower generates predictable lease payments.
[IMAGE: Pie chart showing share of deal value by sector: Energy (48%), Telecom & Digital (33%), Healthcare (6%), Transport (8%), Others (5%). Highlight energy and telecom segments.]
The Rise of Sustainable Infrastructure: Solar Leads the Green Transition
Sustainable infrastructure investments—defined as projects with explicit environmental or climate objectives—totaled US$19 billion across 305 deals between 2012 and 2023, representing 40% of total deal value. This is a striking shift: green projects have moved from niche to mainstream in Africa’s private capital landscape.
Solar dominated sustainable deals, accounting for 63% of volume, followed by wind (12%) and hydroelectric (8%). The abundance of solar irradiation across Africa makes photovoltaic installations highly viable, and falling panel costs have improved project economics. Many solar projects are structured as IPPs under long-term power purchase agreements (PPAs) with state utilities or off-takers, providing the revenue certainty private investors demand.
Sub-Saharan Africa attracted 41% of volume and 50% of value of global blended finance infrastructure deals from 2013 to 2022, according to the OECD. Blended finance—the strategic use of concessional capital from development finance institutions to de-risk projects for private investors—has been particularly successful in sustainable energy. For example, the Scaling Solar programme in Zambia and Senegal used World Bank guarantees to attract competitive bids for utility-scale solar projects. This model has become a template for de-risking green projects in frontier markets.
[IMAGE: Photo of a large solar installation in Africa with workers inspecting panels, with a caption noting that solar accounts for 63% of sustainable infrastructure deals.]
Geographic and Deal Size Dynamics: Who Wins and Where?
Southern Africa led in deal volume with 27% of all projects, driven largely by South Africa’s mature renewable energy independent power producer procurement programme (REIPPPP). East Africa followed closely, with significant activity in Kenya (geothermal and wind) and Ethiopia (hydro and telecoms). West Africa attracted substantial value from Nigeria’s telecom infrastructure and Ghana’s oil-and-gas related projects, while North Africa’s deals centred on Morocco’s solar and wind farms and Egypt’s gas-fired power plants.
Deal size distribution reveals a two-speed market. The 16 megadeals above US$500 million were concentrated in energy and telecom, often backed by multilateral lenders or sovereign wealth funds. Meanwhile, the vast majority of projects—smaller than US$50 million—are scattered across multiple sectors and countries, often led by local investors or impact funds. These smaller deals are critical for reaching underserved regions, but they struggle to achieve the scale necessary to bridge the US$100 billion annual gap.
The geographic pattern also underscores a risk-aversion bias. Countries with stronger regulatory frameworks, higher credit ratings, and more transparent procurement processes—such as South Africa, Kenya, and Morocco—attract the lion’s share. Fragile states, which often have the greatest infrastructure needs, remain largely bypassed by private capital.
[IMAGE: Map of Africa with heatmap overlay showing deal concentration in Southern and East Africa, with marker labels for key projects (e.g., REIPPPP in South Africa, Lake Turkana Wind in Kenya, Noor Solar in Morocco).]
The Hidden Drain: Low Tax Base and Heavy Public-Sector Reliance
Why doesn’t the surge in private capital translate into a smaller financing gap? One answer lies in the structural limitations of Africa’s public finances. Most infrastructure in Africa is still funded by governments—national budgets, multilateral loans, and aid. Private capital supplements, but does not replace, public spending. And public spending itself is constrained by low tax revenues.
Africa’s average tax-to-GDP ratio is about 16%, compared to 34% in OECD countries. This means governments have limited fiscal space to invest in the roads, schools, water systems, and hospitals that private capital avoids. Even when private investors do step in—for example, building a toll road—the government must often provide guarantees or subsidies, further straining public budgets.
The result is a lopsided landscape: private capital flows to sectors where revenues can be contracted (energy, telecom), while the state is left to fund the rest—transport, water, sanitation, and social infrastructure. But the state is under-resourced, and the gap widens.
[IMAGE: Comparison chart of average tax-to-GDP ratio: Sub-Saharan Africa (16%) vs. OECD (34%), with annotation noting impact on infrastructure spending capacity.]
Blended Finance: A Bridge Too Narrow?
Blended finance has emerged as a key tool to channel private capital into underserved sectors and regions. By using concessional funds (e.g., from the World Bank, European DFIs, or climate funds) to absorb first-loss risk, blended structures can make projects bankable that would otherwise be too risky. As noted, Sub-Saharan Africa has been a leading recipient of blended finance for infrastructure.
However, blended finance remains small relative to the need. Total blended finance for infrastructure in Africa averaged about US$4–5 billion annually from 2013 to 2022, a fraction of the US$100 billion gap. Moreover, blended structures are complex, time-consuming to negotiate, and often favour large-scale projects over small, community-level ones. Critics argue that blended finance has yet to demonstrate it can scale to meet systemic needs.
There is also a risk of “picking winners”: blended finance tends to flow to sectors and countries that are already relatively attractive to private capital, reinforcing concentration rather than redressing it. If blended finance is to bridge the gap, it must be deployed more intentionally in transport, water, and social infrastructure in lower-income countries.
[IMAGE: Flowchart showing a typical blended finance structure: concessional capital from DFIs absorbs first-loss layer, private equity/debt takes mezzanine and senior layers, project financed, with arrow to "Infrastructure Asset" in a solar farm or telecom tower.]
Implications for Africa’s Infrastructure Future
The paradox of surging private capital alongside a widening financing gap will persist unless structural changes are made. Several implications stand out.
First, African governments must strengthen their domestic revenue mobilisation—broadening tax bases, improving collection, and reducing illicit financial flows. Without a stronger public fiscal base, the state cannot fulfil its role as the primary funder of core infrastructure.
Second, private capital will continue to flow to energy and telecom unless governments and development partners actively de-risk other sectors. Instruments such as partial risk guarantees, local currency financing, and standardised contracts for transport projects could unlock private investment in roads and ports. For example, the African Development Bank’s Africa50 infrastructure fund is attempting to do this, with mixed results.
Third, the rise of sustainable infrastructure is a bright spot, but it must be managed to ensure that green transitions do not exacerbate inequality. Solar farms and wind parks often serve industrial users or export electricity, while rural households remain off-grid. Decentralised renewable solutions—mini-grids, standalone solar—need blended finance tailored to smaller, dispersed projects.
Fourth, deal sizes matter. The dominance of small deals (73% under US$50 million) suggests that a vibrant ecosystem of local and regional investors is emerging. These smaller players are often more familiar with local risks and can reach communities that megadeals cannot. Policymakers should support them through streamlined regulatory processes, local currency guarantees, and capacity building.
Finally, blended finance must evolve from a niche tool to a systemic one. That means larger pools of concessional capital, faster approval cycles, and a willingness to fund "boring" infrastructure—water pipes, school buildings, secondary roads—that lack the glamour of solar farms or 5G towers but are essential for human development.
[IMAGE: Photo of a rural unpaved road with a few children walking, overlayed with text: "Transport accounts for 73% of Africa's infrastructure financing gap, yet receives only 8% of private capital deals."]
Conclusion: Confronting the Paradox
Africa’s infrastructure investment paradox is not a failure of private capital; it is a reflection of market logic. Private capital follows risk-adjusted returns, and in Africa, those returns are most abundant in energy and telecom. The surge in deal volume is real and welcome, but it is not solving the continent’s core infrastructure crisis.
The US$47.3 billion deployed over 12 years is less than half of what Africa needs annually. To close the US$100 billion gap, the continent must mobilise a mix of private, public, and blended finance—but with a clear understanding that private capital cannot, and will not, do it alone. The responsibility for transport, water, and social infrastructure remains squarely with governments and their development partners.
The paradox will only be resolved when policy, finance, and innovation converge to make the "uninvestable" investable. Until then, the lights will keep turning on in Africa’s cities, and the data will keep flowing through its fibre cables—but millions will still walk on unpaved roads, drink unsafe water, and study in crumbling classrooms.