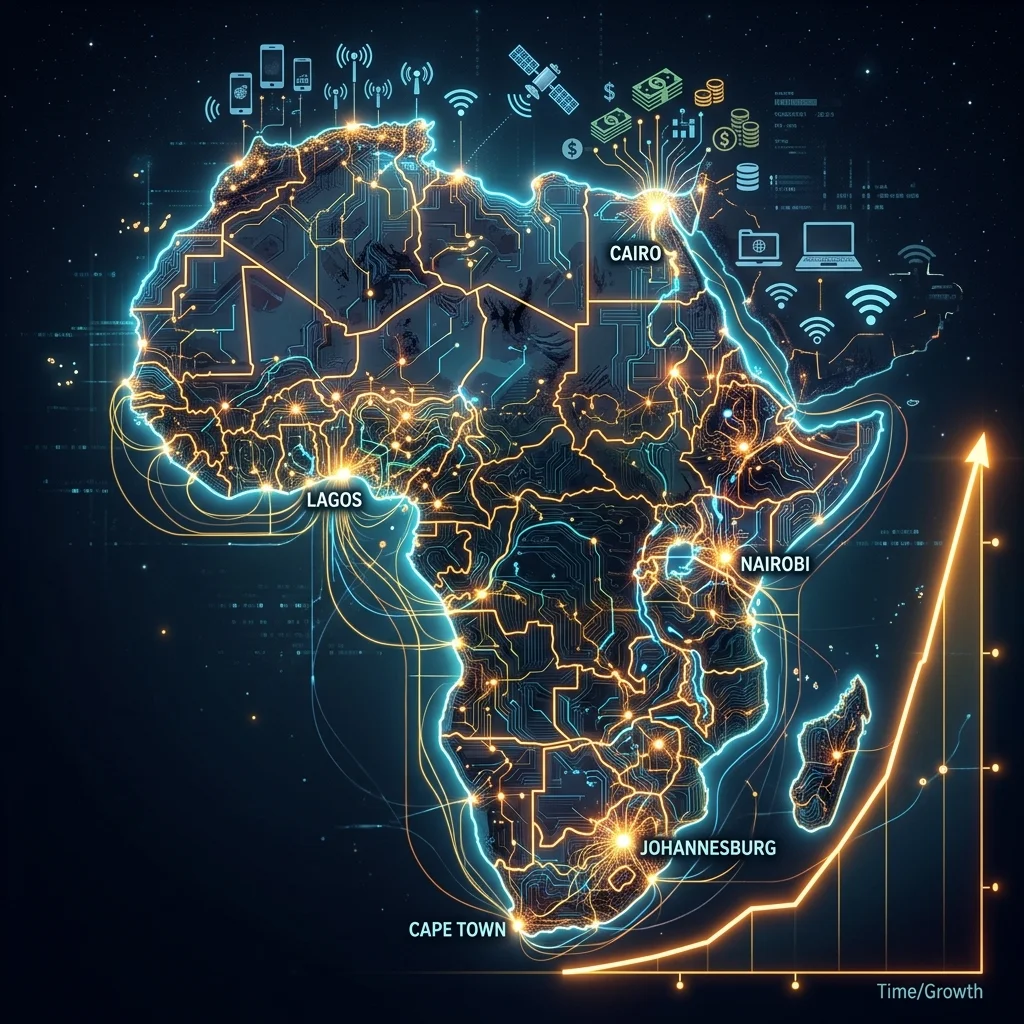
Africa’s digital economy is on a steep growth trajectory, projected to surge
Africa’s Digital Economy: From 1.1% to 8.5% of GDP – The Promise and the Peril of Uneven Growth
By a Senior Technical/Financial Audit Journalist
---
Introduction: The Quiet Revolution and the Widening Gulf
In 2012, Africa’s digital economy contributed an estimated 1.1% to continental GDP, valued at approximately US$30 billion (Source 1: [Primary Data: Google/IFC 2020 Study]). By 2020, that figure had risen to 4.5%—US$115 billion—representing a quadrupling of economic share in less than a decade. Projections indicate that by 2050, Africa’s digital economy could reach 8.5% of GDP, equivalent to US$712 billion (Source 1: [Primary Data: Google/IFC 2020 Study]).
These figures suggest one of the fastest digital economic transformations of any global region. However, a granular examination of country-level data reveals a more complex and troubling reality: the growth is profoundly uneven. The UNCTAD B2C E-commerce Index 2020 scores South Africa at 56.5 points and Niger at 5.6 points—a tenfold disparity that signals a bifurcation of Africa’s digital future (Source 2: [Primary Data: UNCTAD 2020 B2C E-commerce Index]).
This article examines the structural drivers of growth, the empirical evidence of divergence, and the long-term implications of a two-speed digital Africa where the dividends of connectivity accrue disproportionately to a small cohort of leading nations.
---
1. The Growth Story: What’s Driving Africa’s Digital Boom?
Infrastructure and Connectivity
The foundation of Africa’s digital growth rests on three interconnected developments. First, submarine cable investments have dramatically improved international bandwidth capacity. The deployment of cables including SEACOM, EASSy, WACS, and more recently 2Africa has reduced wholesale internet costs by over 90% in some coastal markets since 2010 (Source 3: [Industry Analysis: TeleGeography Bandwidth Reports]). Second, mobile penetration across the continent reached approximately 46% unique subscribers in 2021, with smartphone adoption exceeding 50% in several markets (Source 4: [Industry Data: GSMA Mobile Economy Sub-Saharan Africa 2022]). Third, declining data costs—driven by both infrastructure competition and regulatory pressure—have expanded the addressable user base.
Startup Ecosystem Capital Inflows
Venture capital investment into African tech startups reached a record US$6.5 billion in 2022, with the major hubs—Nigeria, Kenya, South Africa, and Egypt—capturing over 80% of total funding (Source 5: [Market Data: Partech Africa Venture Capital Report 2022]). Fintech alone accounted for approximately 60% of this capital, driven by the success of mobile money platforms such as M-Pesa in Kenya, which processes over US$300 billion annually (Source 6: [Company Data: Safaricom Annual Report 2023]). Adjacent sectors including agritech (e.g., Twiga Foods in Kenya), healthtech (e.g., mPharma in Ghana), and logistics (e.g., Kobo360 in Nigeria) have attracted substantial capital as investors bet on digital solutions to address structural inefficiencies.
Policy Frameworks
Regulatory reforms have played a measurable role. Kenya’s early regulatory accommodation of M-Pesa created a template replicated in varying degrees across East and West Africa. Rwanda has implemented a single digital ID system and simplified business registration procedures. Morocco’s "Maroc Numeric" strategy provided targeted subsidies for digital adoption among small and medium enterprises. These policy interventions correlate with higher internet economy GDP shares.
Quantitative Evidence from Accenture and Google/IFC
An Accenture study published in 2020 quantified the internet economy contributions for 11 African countries (Source 7: [Primary Data: Accenture "Digital Economic Value of the Internet in Africa" 2020]). The data reveals a clear hierarchy:
| Country | 2020 Internet Economy (US$B) | % of GDP | 2025 Projected (US$B) | 2025 % of GDP |
|---------|------------------------------|----------|----------------------|---------------|
| South Africa | 21.55 | 6.51% | 31.45 | 7.86% |
| Nigeria | 24.59 | 5.68% | 36.53 | 6.86% |
| Kenya | 7.42 | 7.70% | 12.84 | 9.24% |
| Morocco | 7.80 | 6.82% | 12.09 | 7.84% |
| Egypt | 15.41 | 4.98% | 25.97 | 5.99% |
| Senegal | 1.51 | 6.22% | 2.92 | 7.11% |
| Côte d’Ivoire | 3.18 | 5.27% | 5.53 | 6.04% |
| Ghana | 3.01 | 4.42% | 5.01 | 5.31% |
| Cameroon | 2.06 | 5.39% | 3.27 | 6.19% |
| Tanzania | 2.57 | 3.98% | 4.28 | 4.57% |
| Uganda | 1.36 | 3.82% | 2.26 | 4.18% |
| Rwanda | 0.52 | 4.98% | 0.97 | 5.96% |
(Source 1: [Primary Data: Google/IFC 2020 Study; Source 7: [Primary Data: Accenture 2020])
By 2025, Kenya is projected to lead with an internet economy share of 9.24% of GDP, followed by Morocco (7.84%), South Africa (7.86%), and Senegal (7.11%). These four nations are on trajectory to exceed the continental average by a significant margin. By 2050, Kenya could reach 15.17% of GDP from internet economy alone—a figure comparable to developed digital economies.
---
2. The Disparity Crisis: Reading the UNCTAD Readiness Index
The Numerical Chasm
The UNCTAD B2C E-commerce Index 2020 provides a composite measure of e-commerce readiness across four components: secure internet servers, internet usage penetration, postal reliability, and credit card penetration (Source 2: [Primary Data: UNCTAD 2020 Index Methodology]). The index scores for select African nations reveal extremes that demand scrutiny:
- South Africa: 56.5
- Morocco: 48.7
- Kenya: 41.8
- Nigeria: 32.8
- Uganda: 16.2
- Tanzania: 12.8
- Niger: 5.6
- Central African Republic: 4.0
(Source 2: [Primary Data: UNCTAD 2020 B2C E-commerce Index])
A score of 56.5 versus 5.6 is not merely a gap; it represents fundamentally different digital ecosystems. To contextualize: South Africa’s score is comparable to countries in Eastern Europe. Niger’s score is comparable to conflict-affected states in the lowest global quintile.
Deconstructing the Drivers of Disparity
The index components reveal structural bottlenecks that extend beyond wealth. Secure server penetration (measured per million inhabitants) shows the widest variance: South Africa has over 1,800 secure servers per million; Niger has fewer than 5 (Source 2: [Primary Data: UNCTAD 2020 Index Sub-Components]). This metric reflects the availability of encrypted transaction infrastructure—a prerequisite for e-commerce.
Postal reliability scores, measured by the Universal Postal Union’s Index, show that many West and Central African countries rank in the bottom quartile globally, making physical delivery of digital orders unreliable. Credit card penetration remains below 5% in countries such as Niger, Tanzania, and Uganda, limiting payment options despite high mobile money adoption in some markets.
Internet usage penetration—the share of individuals using the internet—ranges from above 70% in South Africa and Morocco to below 10% in Niger and Chad (Source 8: [Reference Data: ITU World Telecommunication Indicators 2020]). This metric directly limits the size of the addressable digital market.
Structural vs. Cyclical Disparity
The evidence suggests these disparities are structural rather than cyclical. South Africa, Kenya, Morocco, and Senegal possess the institutional infrastructure—functioning postal systems, banking penetration above 30%, regulatory frameworks for digital payments—that enables digital economic activity. Nations scoring below 20 on the UNCTAD index lack multiple foundational layers simultaneously.
A Diplo (Diplo Academy) analysis of digital transformation in Africa noted that "Africa’s digital economy is on a growing trend," but the growth pattern exhibits "increasing returns to scale" dynamics (Source 9: [Analysis: Diplo Digital Policy Observatory 2021]). Leading nations attract disproportionate investment, develop deeper talent pools, and achieve network effects that accelerate their advantage. Laggard nations face compound barriers: poor connectivity limits usage, low usage limits investment, lack of investment perpetuates poor connectivity.
---
3. The 2050 Projection: Acceleration or Divergence?
Extrapolating Current Trajectories
If current growth rates for the internet economy as a percentage of GDP are maintained—based on the compounded annual growth rates implied by the 2020-to-2025 projections—a clear pattern emerges:
High-trajectory nations (2025 GDP share >7%):
- Kenya: 9.24% → 15.17% (2050)
- South Africa: 7.86% → 12.92% (2050)
- Morocco: 7.84% → 12.88% (2050)
- Senegal: 7.11% → 11.68% (2050)
Mid-trajectory nations (2025 GDP share 5-7%):
- Nigeria: 6.86% → 11.27% (2050)
- Cameroon: 6.19% → 10.16% (2050)
- Côte d’Ivoire: 6.04% → 9.92% (2050)
- Egypt: 5.99% → 9.83% (2050)
- Rwanda: 5.96% → 9.79% (2050)
Low-trajectory nations (2025 GDP share <5%):
- Ghana: 5.31% → 8.73% (2050)
- Tanzania: 4.57% → 7.50% (2050)
- Uganda: 4.18% → 6.87% (2050)
(Source 1: [Primary Data: Google/IFC 2020 Study Projections])
The absolute GDP value differential is even more revealing. By 2050, Nigeria’s internet economy alone is projected at US$145.28 billion—larger than the entire digital economy of most African nations. South Africa’s internet economy is projected at US$125.08 billion. Kenya’s at US$51.07 billion. These three nations could account for over 45% of Africa’s total internet economy by 2050, despite representing less than 25% of the continent’s population.
The Feedback Loop of Divergence
The mechanism driving divergence is a three-part feedback loop. First, venture capital follows existing digital infrastructure and skilled labor markets. The top four destinations—Nigeria, Kenya, South Africa, Egypt—receive 80% of startup funding, which builds more infrastructure and talent (Source 5: [Market Data: Partech Africa 2022]). Second, higher internet usage rates in leading nations create larger markets for digital services, attracting global platform companies (Google, Meta, Amazon Web Services) to establish local data centers and cloud infrastructure, further reducing latency and costs. Third, governments in leading nations implement more sophisticated regulatory frameworks—data protection laws, digital identity systems, open banking regulations—that enable further digital economic formalization.
The risk of a permanent two-speed Africa is structural. Without intervention, nations currently scoring below 20 on the UNCTAD index—representing approximately 200 million people—may remain digital consumers rather than digital participants, capturing less than 1% of the continent’s digital GDP growth.
---
4. Structural Implications for Investment and Policy
Infrastructure Bottlenecks at the Frontier
The most binding constraint for laggard nations is not smartphone penetration but the absence of enabling infrastructure beyond connectivity. The UNCTAD index’s postal reliability component reflects a logistical reality: e-commerce requires delivery. In countries where the postal system functions poorly, digital commerce remains constrained to digital goods and services. Similarly, low credit card penetration—or absence of interoperable mobile money rails—limits the transaction surface.
The International Finance Corporation has estimated that closing Africa’s digital infrastructure gap requires US$100 billion in investment by 2025 (Source 10: [Institutional Report: IFC "Digital Infrastructure in Africa" 2021]). Current investment levels are approximately US$15 billion annually, with concentration in nations that already have above-average digital readiness.
Human Capital as a Multiplier
The Google/IFC projections assume a correlation between digital economy growth and improvements in digital literacy, technical education, and entrepreneurial capacity. The countries with the highest internet economy shares—Kenya, South Africa, Morocco—have invested substantially in coding academies, university computer science programs, and tech incubators. Kenya produces approximately 5,000 computer science graduates annually; Niger produces fewer than 200 (Source 11: [Educational Data: UNESCO Science Report 2021]).
This human capital gap compounds over time. Leading nations generate a growing pool of talent that attracts multinational technology companies to establish engineering hubs, which train more talent in a virtuous cycle. Laggard nations face a brain drain challenge where their limited technical graduates migrate to digital hubs.
Regulatory Divergence
A further dimension of disparity emerges in regulatory environment. Kenya’s progressive approach to mobile money regulation enabled M-Pesa’s growth. Rwanda’s centralized digital transformation strategy has produced measurable gains in government service digitization. South Africa’s Protection of Personal Information Act (POPIA) provides a data governance framework that facilitates international data flows.
Conversely, several African nations maintain policies that constrain digital growth: high import tariffs on smartphones and network equipment, restrictions on foreign investment in telecommunications, limited spectrum allocation for mobile broadband, and absence of data protection frameworks that create uncertainty for international investors.
---
5. Market Predictions and Neutral Forecasts
Prediction 1: Concentration of Digital GDP Growth
By 2050, the five leading digital economies—Nigeria, South Africa, Egypt, Kenya, and Morocco—will account for approximately 65-70% of Africa’s total internet economy value, consistent with current concentration trends. This concentration will be driven by compounding advantages in infrastructure density, capital access, and human capital development.
Prediction 2: Emergence of Secondary Hubs
Senegal, Côte d’Ivoire, and Rwanda have demonstrated sufficient growth velocity to become secondary digital hubs, each achieving internet economy shares above 9% by 2050. Rwanda’s centralized digital strategy and Senegal’s Francophone talent pool position them as regional centers in West and Central Africa.
Prediction 3: Persistent Digital Underclass
A group of nations—including Niger, Chad, Central African Republic, and South Sudan—will likely remain below 3% internet economy share of GDP through 2040, constrained by the compound effects of low connectivity, weak institutions, and minimal investment. These nations represent a policy failure risk that multilateral development institutions will need to address through dedicated digital inclusion programs.
Prediction 4: Infrastructure Investment as the Proximate Determination
The single highest-leverage variable for closing the disparity gap is investment in foundational digital infrastructure in laggard nations. Every 10-point increase in UNCTAD e-commerce readiness score for a low-scoring nation would require coordinated investment in secure server capacity (estimated US$50-100 million per country), postal system modernization (US$20-50 million), and mobile payment interoperability (US$10-30 million) (Source 12: [Institutional Estimate: World Bank Digital Development Unit 2021]).
---
Conclusion: The Arithmetic of Inclusion
Africa’s digital economy trajectory from 1.1% to 8.5% of GDP represents an economic transformation of historic proportions. The data from Accenture, Google/IFC, and UNCTAD confirms that the growth is real, measurable, and accelerating. However, the same data reveals a continental digital economy that is increasingly polarized between a cohort of leaders approaching double-digit digital GDP shares and a tail of nations stranded below 5%.
The UNCTAD e-commerce readiness score of 56.5 for South Africa versus 5.6 for Niger is not merely a statistic; it is a diagnostic of differential access to the economic future. Without deliberate intervention—targeted infrastructure investment in laggard nations, harmonized regulatory frameworks, human capital development programs—the digital divide within Africa will widen. The promise of an 8.5% digital economy by 2050 will be realized, but it will be a promise delivered to a minority of Africans while the majority remain on the analog side of the digital frontier.
The arithmetic is stark: a US$712 billion digital economy shared among 1.5 billion Africans yields approximately US$475 per capita. A US$712 billion digital economy concentrated among 300 million Africans yields approximately US$2,373 per capita. The policy choices made in the next five to ten years will determine which of these futures materializes.
---
Data sources referenced in this article are from the following: Google/IFC "Africa’s Digital Economy" Study 2020; UNCTAD B2C E-commerce Index 2020; Accenture "Digital Economic Value of the Internet in Africa" 2020; Partech Africa Venture Capital Report 2022; GSMA Mobile Economy Reports; ITU World Telecommunication Indicators; World Bank Digital Development Unit estimates.